 ChipBuddy
← Home
ChipBuddy
← Home
The Clock Tree Debugger
By this point in the flow you have a synthesized clock tree, a stack of timing reports, and a nagging feeling that the numbers are not telling you the whole story. A report can tell you that global skew on a domain is 92 ps when your target was 40 ps. What a flat text report cannot easily tell you is which two leaf flops are pulling against each other, which buffer in the middle of the fan-out cone is overloaded, or whether the problem is structural (a lopsided tree) or electrical (a fat net with brutal RC). For that, you reach for the interactive, graphical clock-tree debugger. This chapter treats the debugger as a category of tool rather than any one product. Every serious physical-design environment ships something like it, and the panels, gestures, and mental model are remarkably consistent across them. Learn the concepts and you can sit down in front of any vendor's debugger and be productive in an afternoon.
Why an Interactive Debugger Exists
Static reports are aggregations. They collapse a three-dimensional, branching, physically-routed structure into a column of numbers. Aggregation is exactly what you want for sign-off bookkeeping and exactly what you do not want for root-causing. Root-causing is a search problem: you start from a symptom (excess skew, latency outlier, a slew violation) and you need to walk backward through the cause-and-effect chain until you find the one branch, buffer, or net that is responsible. A graphical debugger turns that search from a manual cross-referencing exercise — grepping net names across three report files — into a guided, visual trace. You see the tree. You click a sink. You
watch the path light up from root to leaf. You read off the per-stage contributors in order. The debugger does not compute anything the reports do not; it presents the same data in a form that matches how the human brain hunts for anomalies.
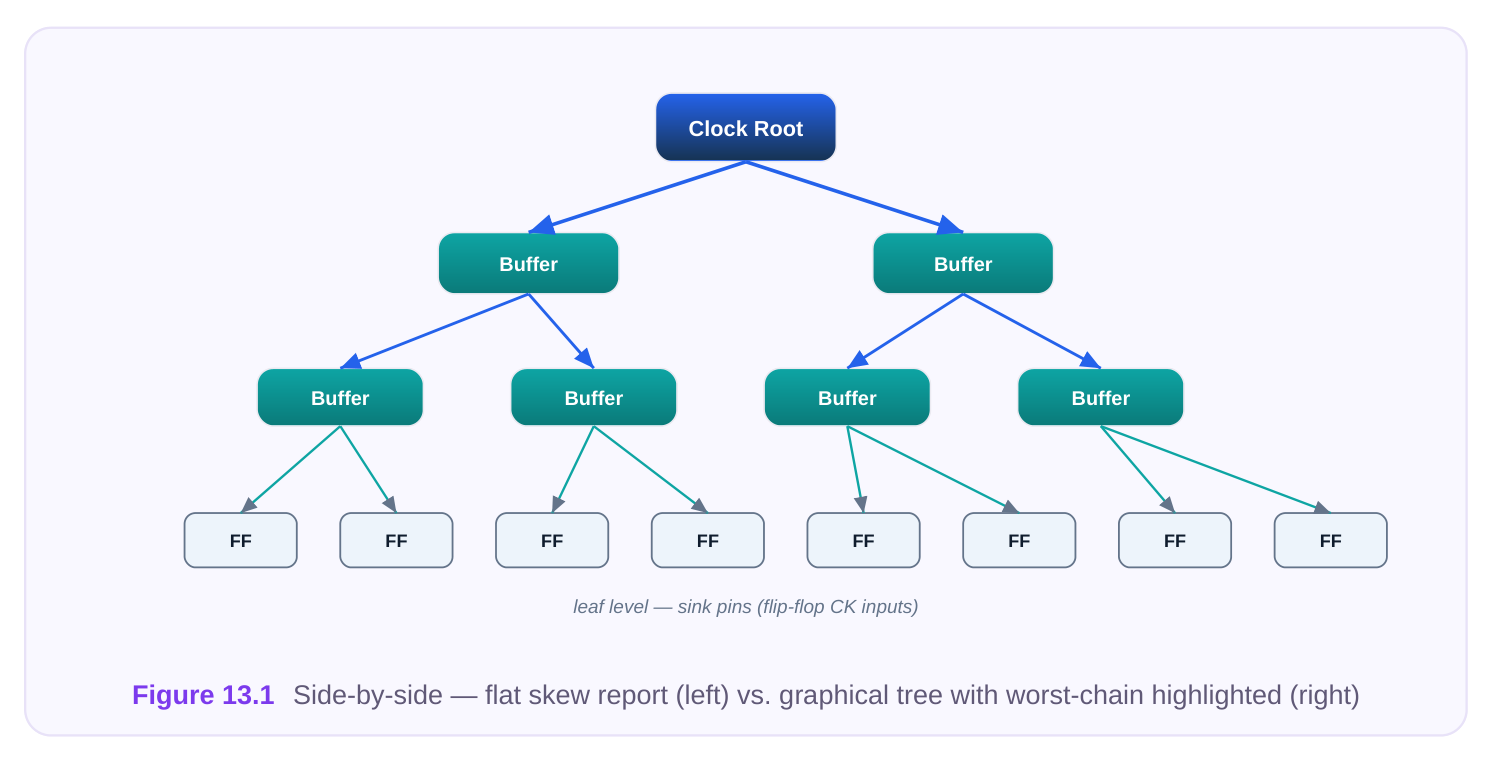
What the Debugger Reveals
The value of the tool is in the set of views it can render on demand. Each view answers a specific diagnostic question.
| Feature | What it reveals |
|---|---|
| Tree topology view | Overall shape and balance of the clock network; lopsided or excessively deep |
branches
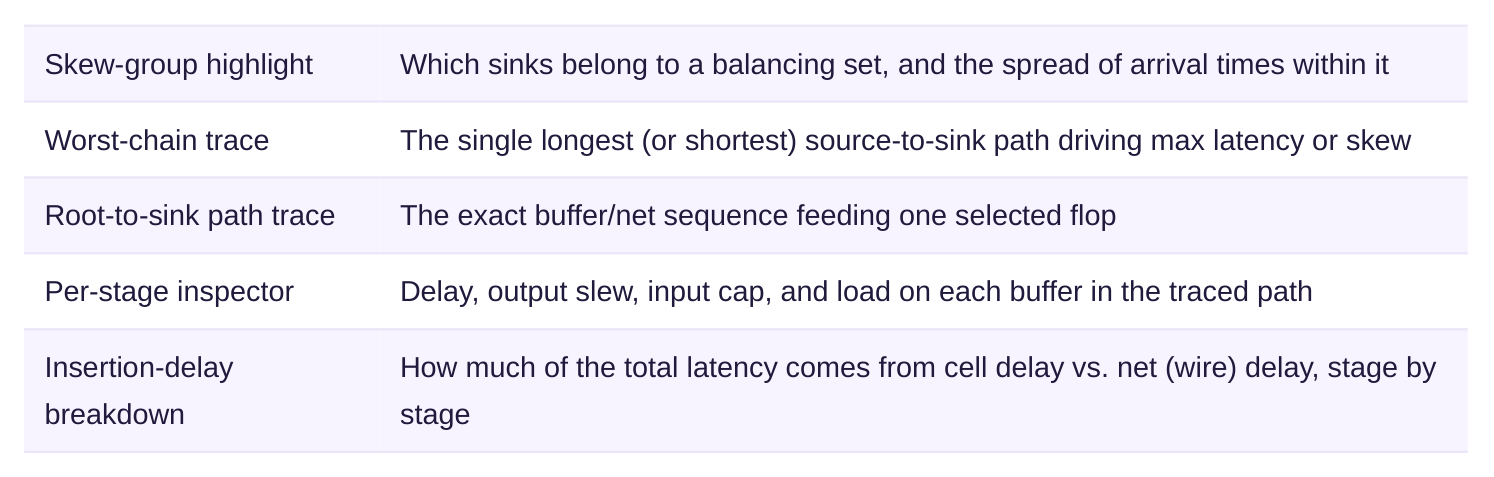
become visible
Driver/load annotation Fan-out count and total capacitance at each tap point they answer the question that dominates real debugging: is this latency coming from too many buffer
stages, or from one buffer driving a wire that takes a scenic route around a macro? The breakdown tells you cell-vs-wire; the overlay shows you why the wire is long.
The Anatomy of a Debugger
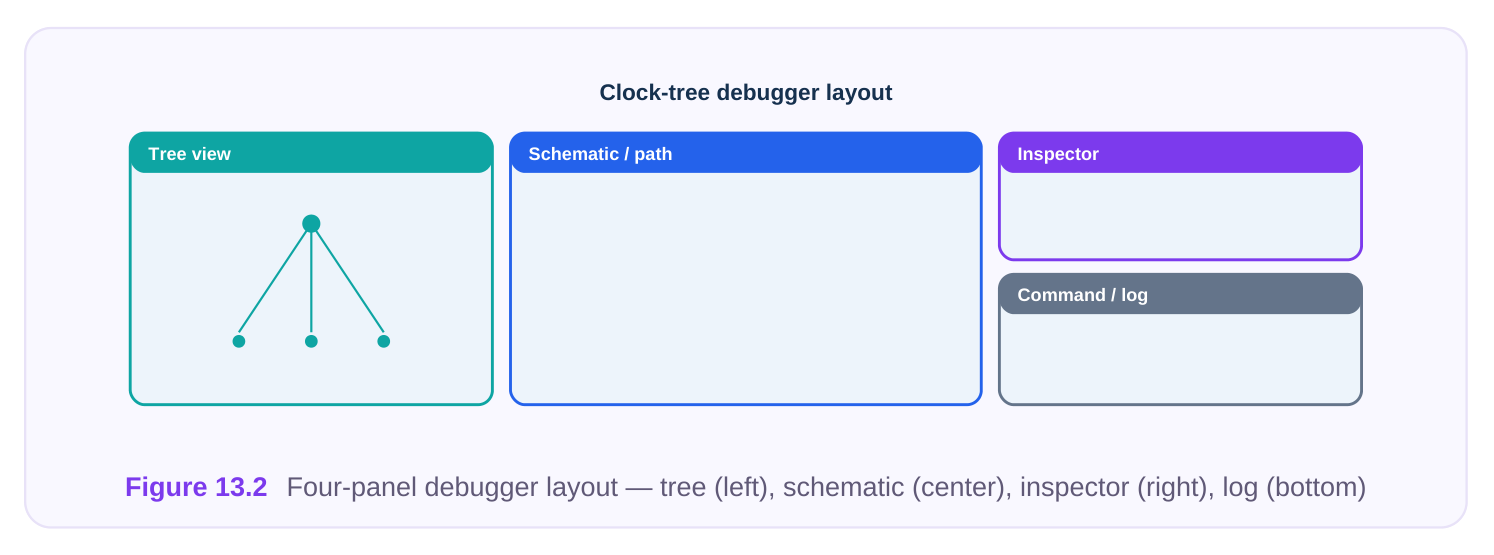
Whatever the branding, you will find roughly four panels. Knowing what each is for keeps you from drowning in the UI.
| Panel | Purpose |
|---|---|
| Tree / hierarchy view | Browse the clock network as a collapsible tree; pick a domain, branch, or sink to |
focus on
Schematic / path See the selected path as a logical chain of cells and nets, in driver-to-load order
| Property inspector | Read numeric attributes (delay, slew, cap, fan-out, transition) for the selected object |
|---|---|
| Command / log pane | Type scripted queries, replay actions, and capture a reproducible debug trail |
The tree view is your map. It is where you start, because it shows balance at a glance — a healthy tree looks like a reasonably symmetric fan-out; a sick one has one branch plunging far deeper than its siblings. The schematic/path view is your microscope. Once you have selected a suspect sink or chain, this panel linearizes it: root buffer, net, next buffer, net, ... leaf. Arrival time accumulates left to right, so you can literally watch where the delay jumps. The property inspector is your readout. Click any cell or net and the inspector dumps its attributes. This is where "buffer B is driving 0.42 pF when its sibling drives 0.11 pF" becomes obvious. The command/log pane is your notebook and your automation hook. Everything you click usually has a text-command equivalent, which means a good debug session can be saved and replayed — invaluable when you hand the case to a colleague or re-run after an ECO.
Launching and Driving the Debugger
You typically invoke the debugger on a design that is already loaded, after CTS or CCD has run, with timing data available. The exact invocation is tool-specific; the shape of it is not.
# illustrative — generic syntax, not tool-specific
# Open the interactive clock-tree debugger on the current design
open_clock_debugger
# Scope it to one clock domain so you are not staring at every net at once
debug_clock -clock CLK_CORE
# Highlight the worst skew chain in that domain
debug_clock -clock CLK_CORE -show worst_skew_chain
From there, most work is point-and-click, but the power users drive it from the command pane because clicks are not reproducible and commands are. A typical scripted drill-down looks like this:
# illustrative — generic syntax, not tool-specific
# Select a specific sink we suspect from the skew report
debug_select_sink U_dpath/reg_bank/q_reg[42]/CK
# Trace the full path from clock root to that sink
debug_trace_path -from_root -to_selected
# Dump per-stage delay and slew for everything on the traced path
report_debug_path -stages -columns {cell_delay net_delay out_slew load_cap}
Note the distinction the brief asks us to be honest about: commands like create_clock ,
set_clock_uncertainty , and report_timing are genuinely portable, industry-standard SDC/STAsyntax that you will find essentially everywhere. The debug_* and open_clock_debugger commands above are illustrative pseudo-commands — they convey the workflow but are not real tool syntax and will not run verbatim anywhere. Always check your environment's actual command reference.
Unit-Delay Mode: Separating Structure from Electricity
One of the most underused features is unit-delay mode (sometimes called ideal-delay or topology mode). Normally the debugger shows real delays, which fold together two completely different kinds of problem:
- 1. Structural problems — the shape of the tree is wrong (too deep on one branch, unbalanced fan-
out, a sink that got tapped off the wrong level).
- 2. Electrical problems — the shape is fine but a net is too long, a buffer is undersized, or a load is too
heavy. Unit-delay mode collapses every stage to the same nominal delay (say, one "unit" per buffer), ignoring cell sizes and RC entirely. The result is a view of pure topology. If skew persists in unit-delay mode,
the tree is structurally lopsided — adding buffers or upsizing will not save you; you need to rebalance the branching. If skew vanishes in unit-delay mode but reappears with real delays, the structure is sound and the problem is electrical — now you hunt for the fat net or the weak driver.
# illustrative — generic syntax, not tool-specific
# Re-analyze the same domain ignoring real RC/cell delays
debug_clock -clock CLK_CORE -mode unit_delay
# Compare stage counts on the two worst sinks
report_debug_path -compare_sinks {sinkA sinkB} -metric stage_depth
This one technique saves enormous time. It is the clock-tree equivalent of asking "is the algorithm wrong, or is it just slow?" — answer the structural question first, because no amount of electrical tuning fixes a misshapen tree.
A Debugging Walkthrough
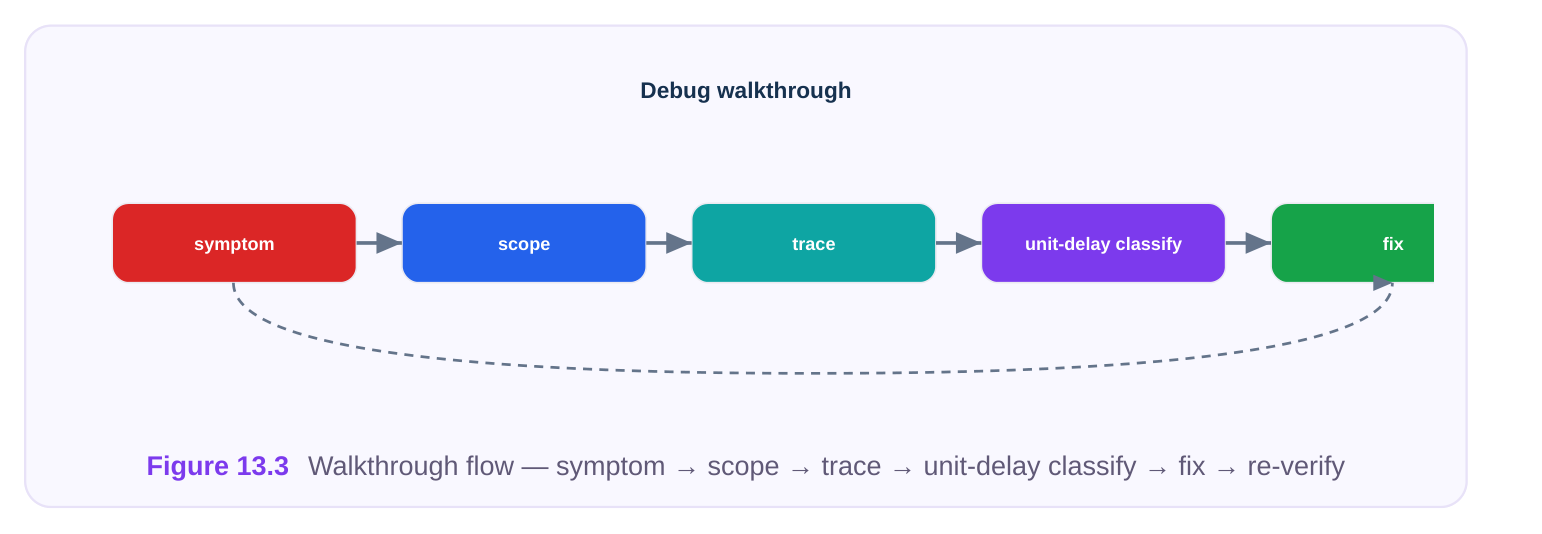
Let us make this concrete with a full symptom-to-fix cycle. The story is generic but the steps are the ones you will actually take. Symptom. Post-CTS timing shows the CLK_CORE domain missing its skew budget: target 40 ps, actual 96 ps. A handful of hold violations appear on a register bank. The summary report names the domain but not the cause. Step 1 — Open and scope. Launch the debugger, scope to CLK_CORE , and ask for the worst skew chain.
# illustrative — generic syntax, not tool-specific
open_clock_debugger
debug_clock -clock CLK_CORE -show worst_skew_chain
The tree view immediately shows an asymmetry: most leaves sit at depth 6, but one branch feeding reg_bank plunges to depth 9. Step 2 — Localize. Select the latest-arriving sink and the earliest-arriving sink in the failing skew group and trace both to the root. The path view shows the late sink running through three extra buffer stages compared with its supposedly-balanced partner. Step 3 — Classify with unit-delay. Flip to unit-delay mode. The skew does not disappear — in fact the depth-9 branch still shows three extra unit stages. That is the tell: this is a structural imbalance, not an RC problem. The property inspector confirms a tap point was inserted at the wrong tree level, likely because that register bank was added late and got buffered onto an existing deep branch instead of getting its own balanced sub-tree. Step 4 — Inspect for confirmation. Click through the extra stages in the inspector. Cell delays are unremarkable; nets are short. Nothing electrical is wrong — which is exactly what unit-delay mode predicted. The problem really is the topology.
Step 5 — Fix. Because the issue is structural, the remedy is a targeted re-synthesis or a localized ECO that re-taps reg_bank at the correct depth and rebalances that sub-tree. You might also pin the offending sinks into the correct skew group so the next CTS pass balances them with their true partners.
# illustrative — generic syntax, not tool-specific
# Force the mis-tapped sinks into the intended balancing group, then re-synth that
cone
group_clock_sinks -clock CLK_CORE -group core_dpath \
-sinks {U_dpath/reg_bank/*/CK}
resynth_clock_subtree -clock CLK_CORE -group core_dpath -balance
Step 6 — Re-verify. Re-run CTS analysis (or the incremental ECO timing), reopen the debugger on the same domain, and re-trace. The branch depth is now uniform at 6–7, the unit-delay view is flat, real-delay skew drops to 38 ps, and the hold violations clear. Confirm with the portable, vendor-neutral commands you trust for sign-off:
# portable, industry-standard STA/SDC — runs essentially everywhere
report_clock_timing -type skew -clock CLK_CORE
report_clock_timing -type latency -clock CLK_CORE
report_timing -delay_type min -to [get_pins U_dpath/reg_bank/*/D]
The discipline to copy is: classify before you fix. Unit-delay mode told us not to waste time upsizing buffers or rerouting nets. The fix matched the diagnosis.
Habits That Make the Debugger Pay Off
A few practices separate engineers who solve clock bugs in an hour from those who flail for a day.
- Always scope first. Looking at the whole chip's clock network at once is noise. Pick one domain, one skew group, one chain.
- Trace from both ends of a skew problem. Skew is a difference; you need the early sink and the late sink to see what diverges between them.
- Run unit-delay early. Five seconds in topology mode often saves an hour of misdirected electrical tuning.
- Read delays as cell-vs-wire, not as one number. The split tells you whether the answer is sizing/ insertion (cell-dominated) or placement/routing (wire-dominated).
- Drive from the command pane and save the log. A reproducible debug script lets you re-run after every ECO and hand the case off cleanly.
Interview Q&A
What does an interactive debugger add that the report cannot? The report is an aggregate; it collapses a branching physical structure into numbers. The debugger lets you see the topology, trace an exact root-to-sink path, read per-stage delay/slew/load, split insertion delay into cell vs. wire contributions, and overlay the tree on the floorplan. It turns root-causing from manual crossreferencing of multiple report files into a guided visual search, while presenting the same underlying timing data — it does not compute anything new, it makes the cause findable.
assigns the same nominal delay to every stage, ignoring cell sizing and RC, so you see pure topology. You use it to separate structural problems from electrical ones. If skew persists in unit-delay mode, the tree is structurally unbalanced — rebalance the branching; sizing won't help. If skew disappears in unit-delay mode but returns with real delays, the structure is fine and the problem is electrical — go hunt the long net or weak driver. It answers the "is the shape wrong or is it just the wires?" question first.
stages than its balanced partner, and those extra stages remain in unit-delay mode. What does that tell you, and how do you fix it? That it is a structural imbalance — likely a sink tapped at the wrong tree depth, often because a register bank was added late and buffered onto an existing deep branch instead of getting its own balanced sub-tree. The fix is not electrical tuning; it is to re-group those sinks into their intended balancing set and re-synthesize/rebalance that sub-tree (or do a localized ECO to re-tap at the correct depth), then re-verify skew and the affected hold paths.
matter, and give examples of each. Because copying pseudo-syntax into a real tool wastes time and erodes trust. Portable, industry-standard commands — create_clock , set_clock_uncertainty ,
report_timing , report_clock_timing — are SDC/STA constructs that run essentially everywhereand are safe to memorize. Debugger-driving commands like open_clock_debugger or debug_trace_path are illustrative: they convey the workflow but vary entirely by vendor and will not run verbatim. Knowing which is which means you internalize the portable layer for life and look up the tool-specific layer per environment.
Key Takeaways
- Reports aggregate; the debugger presents. Use reports for bookkeeping and sign-off, the debugger for root-causing.
- The four panels — tree view (map), schematic/path view (microscope), property inspector (readout), and command/log pane (notebook and automation) — cover every diagnostic move you'll make.
- Scope before you stare: one domain, one skew group, one chain.
- Unit-delay mode is the highest-leverage feature: it separates structural imbalance from electrical problems, so you fix the right thing the first time.
- Read insertion delay as cell-vs-wire, pair it with the physical overlay, and you can tell sizing/ insertion problems from placement/routing problems instantly.
- Classify before you fix; trace skew from both ends; drive from the command pane and save the log for reproducibility.
- Know which commands are portable industry standard versus illustrative tool-specific pseudo- syntax — memorize the former, look up the latter.
Comments
Leave a Reply