 ChipBuddy
← Home
ChipBuddy
← Home
Standard-Cell Libraries & Characterization
The Building Blocks Tools Use
A modern chip is not drawn transistor by transistor. That would be impossible for millions of gates. Instead, designers use a standard-cell library: a kit of pre-made, pre-tested logic cells. The tools pick from this kit and place the cells automatically. So the library is the foundation under the whole automated flow. This chapter explains, in plain words, what a standard cell is, how cells line up in rows, what information the library carries, and how cells are characterized (measured) so the timing tools can trust them.
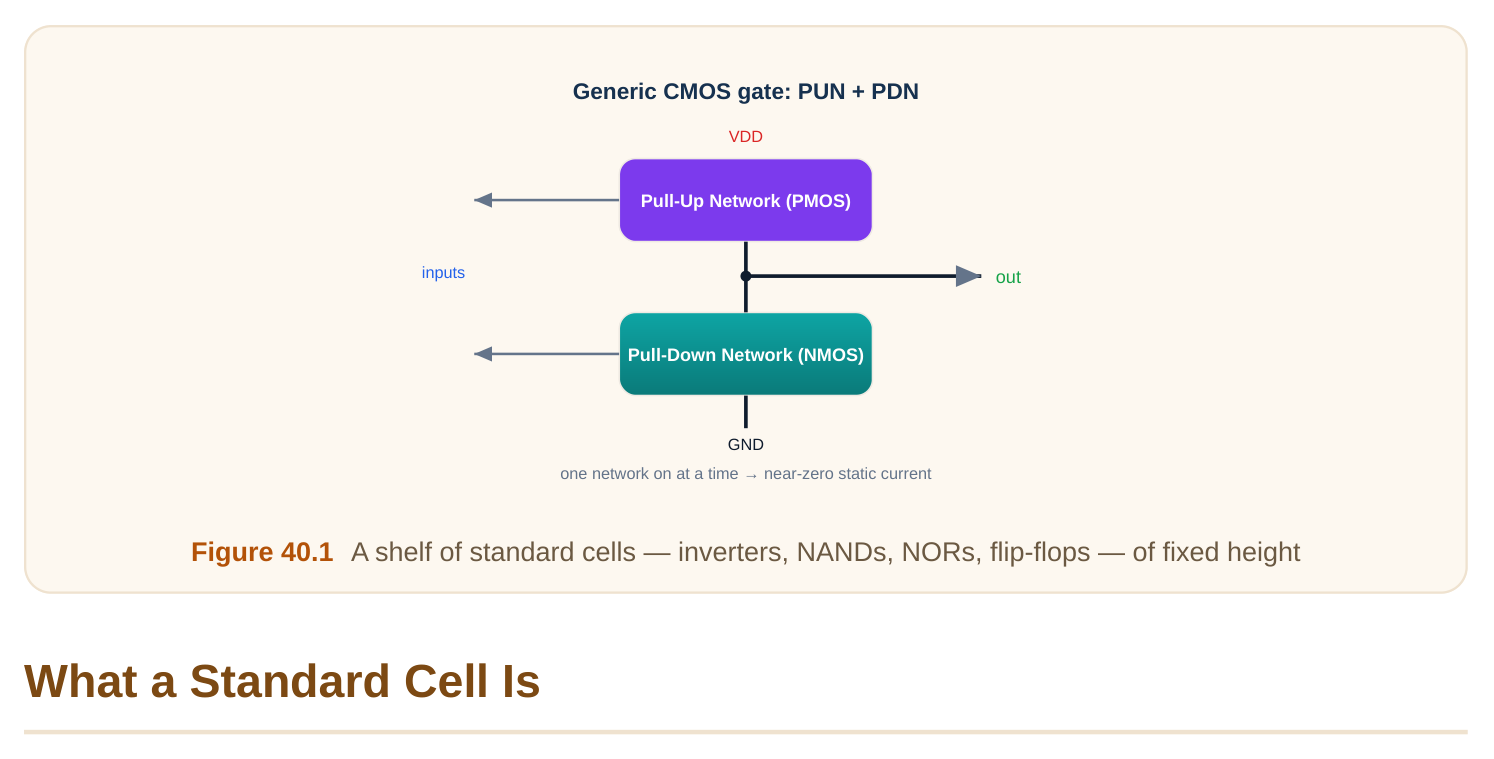
A standard cell is one small, complete logic function, drawn once and reused everywhere. An inverter is a cell. A 2-input NAND is a cell. A flip-flop is a cell. Each is laid out carefully by hand or by a special tool, then stored in the library. The key rule: every cell has the same height. Width varies with complexity — a flip-flop is wider than an inverter — but the height is fixed. This shared height lets cells snap into neat rows, like books of the same height on a shelf.
| Cell | Rough width | Job |
|---|---|---|
| Inverter | narrow | flip a signal |
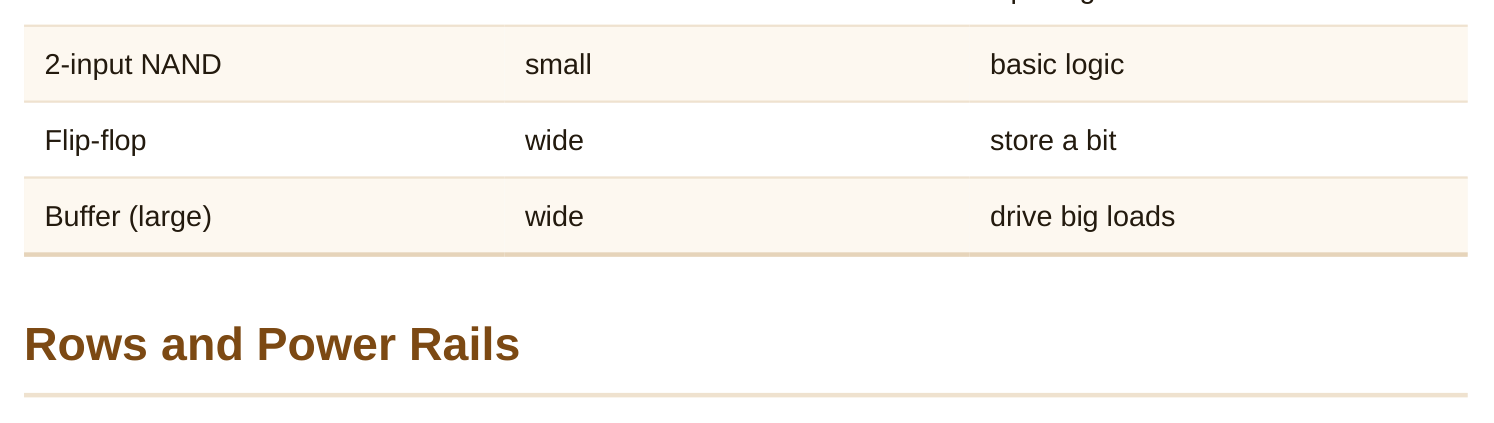
Cells sit in horizontal rows across the chip. Power runs along the top of each row, ground along the bottom. Because every cell is the same height, its power and ground pins line up exactly with the row's rails. Drop a cell into a row and it is powered automatically. Rows often flip every other line so neighbouring rows can share a power or ground rail. This saves area. The regular, striped pattern of powered rows is the backbone of the cell-based layout.
Worked example — row capacity
A row is 2 mm wide. Cells average 1.2 µm wide.
cells per row ≈ 2000 µm / 1.2 µm ≈ 1666 cellsOne row holds well over a thousand cells. A block with many rows holds hundreds of thousands. This regularity is what makes automatic placement possible.
What the Library Carries
A library is more than layout. For each cell it stores several views, because different tools need different things.
- Timing data: how long the cell takes to switch, for every input slew and output load.
- Power data: how much energy the cell uses per switch, plus its leakage.
- Physical view (abstract): where the pins are and what space the cell blocks, for placement and routing.
- Logic view: the Boolean function, for synthesis and checking. View Used by Contains Timing timing analysis delay vs slew and load Power power analysis switch energy, leakage Abstract place & route pin and blockage shapes Logic synthesis, checks the Boolean function The timing and power data are the most subtle. They must be accurate, or every downstream calculation is wrong. That accuracy comes from characterization.
Characterization
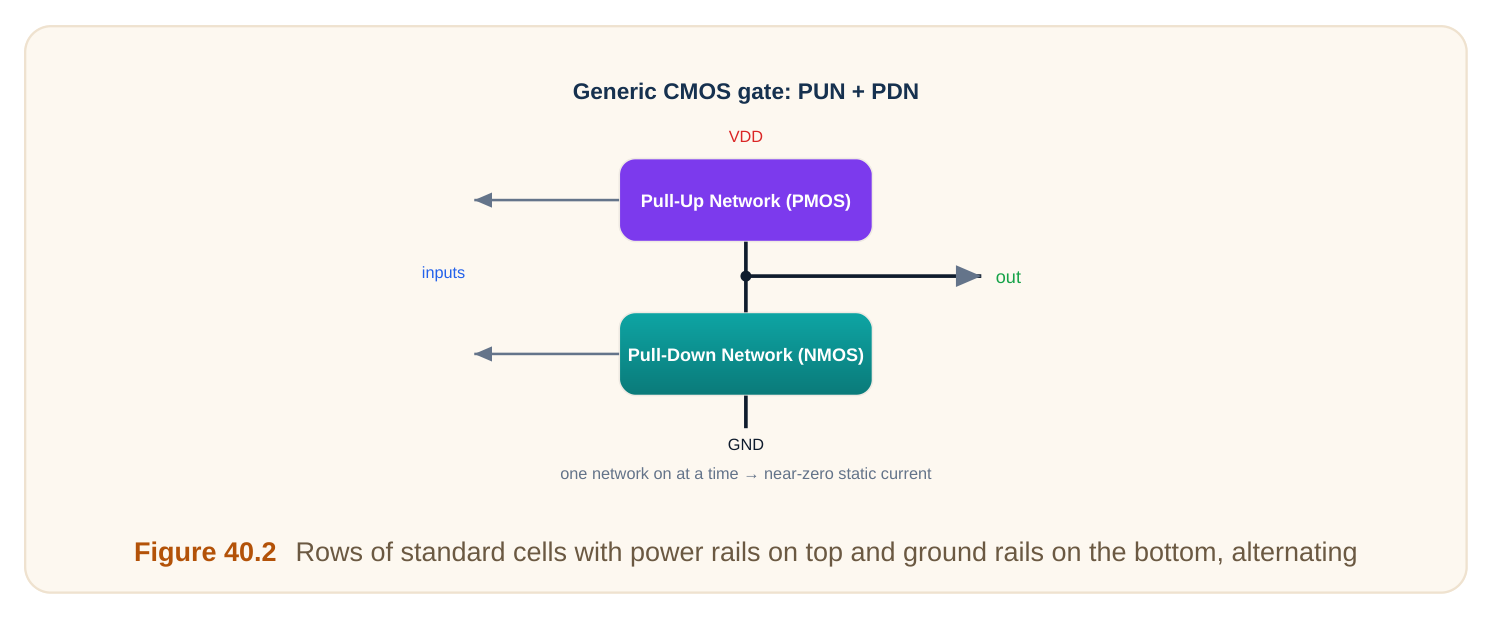
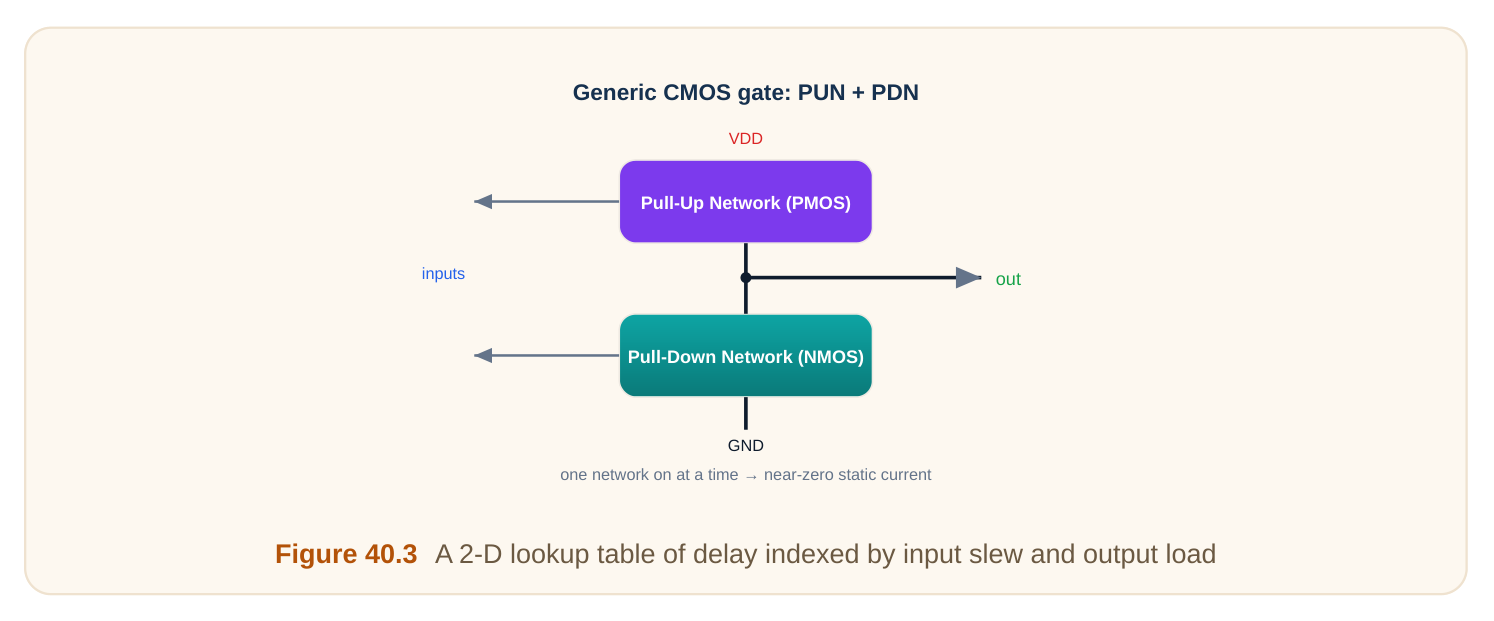
Characterization is the careful measurement of each cell's behaviour. The cell is simulated in detail across many conditions: different input edge speeds (slew), different output loads, different voltages and temperatures. The results are stored as lookup tables. When the timing tool needs a cell's delay, it does not re-simulate. It reads the table for the cell's actual slew and load, and interpolates between table points. This is fast and, because the tables came from detailed simulation, accurate.
Worked example — table lookup
A cell's delay table gives 40 ps at (slew 20 ps, load 5 fF) and 60 ps at (slew 20 ps, load 10 fF). The real load is 7 fF.
fraction = (7 - 5) / (10 - 5) = 0.4
delay = 40 + 0.4 × (60 - 40) = 40 + 8 = 48 ps
The tool interpolates to 48 ps. No new simulation needed. Millions of such lookups run in a single timing analysis.
Multiple Flavours of Each Cell
A good library does not have just one inverter. It has many: different drive strengths and different threshold voltages. Drive strength is how much current the cell can push. A 1× inverter is small; a 4× inverter is four times stronger and drives bigger loads. Threshold flavour trades speed against leakage: a low-threshold cell is fast but leaky; a high-threshold cell is slow but saves power. The tool picks the right flavour per location to balance speed, power, and area.
| Flavour axis | Options | Trade |
|---|---|---|
| Drive strength | 1×, 2×, 4×, 8× | bigger drives more, costs area/power |
| Threshold (Vt) | low / standard / high | speed vs leakage |
Worked example — drive vs load
A net has a 12 fF load. A 1× buffer (drives ~4 fF well) is too weak. A 4× buffer drives ~16 fF.
1× capacity ≈ 4 fF  → too small for 12 fF
4× capacity ≈ 16 fF → comfortably drives 12 fF
The tool upsizes to the 4× buffer so the net switches fast enough. Having many flavours lets it tune each net precisely.
Why the Library Quality Matters
The library sets the ceiling on what any design built from it can achieve. A rich library with many sizes and threshold flavours lets the tools find fast, low-power solutions. A thin library forces compromises. And if the timing data is even slightly off, every chip built from it risks failing in silicon. So library build and characterization is a careful, high-stakes job done before any chip design begins.
Interview Q&A
made logic function (inverter, NAND, flip-flop) drawn once and reused. The key rule is that all cells share the same fixed height, while width varies with complexity, so cells snap neatly into rows.
the top and a ground rail along the bottom. Because every cell has the same height, its power and ground pins line up with the row's rails automatically, and alternating rows can share rails to save area.
versus slew and load), power data (switch energy and leakage), a physical abstract (pin and blockage shapes), and a logic view (the Boolean function). Different tools need different things — timing analysis, power analysis, place-and-route, and synthesis each read their own view.
simulation of each cell across many slews, loads, voltages, and temperatures, stored as lookup tables. The timing tool then reads the table for a cell's actual slew and load and interpolates, getting accurate delay quickly without re-simulating.
2×, 4×…) and threshold-voltage flavours (low/standard/high). Drive strength matches a cell to its load,
and threshold trades speed against leakage, so the tool can tune each location for the best balance of speed, power, and area.
offers, so a rich library enables fast, low-power solutions while a thin one forces compromises. And because all timing comes from the library's tables, even small data errors can make every chip built from it fail — making characterization high-stakes.
Key Takeaways
- A standard cell is a pre-made logic function of fixed height; tools place thousands automatically into rows.
- Rows carry power rails top, ground bottom; matching cell height powers every cell on placement.
- The library stores timing, power, physical, and logic views — each tool reads what it needs.
- Characterization simulates cells into lookup tables; timing tools interpolate for fast, accurate delay.
- Many drive strengths and threshold flavours let tools tune speed, power, and area per net.
Comments
Leave a Reply